Sioux silos
A sensors controller dashboard
- Figma
- React
The context
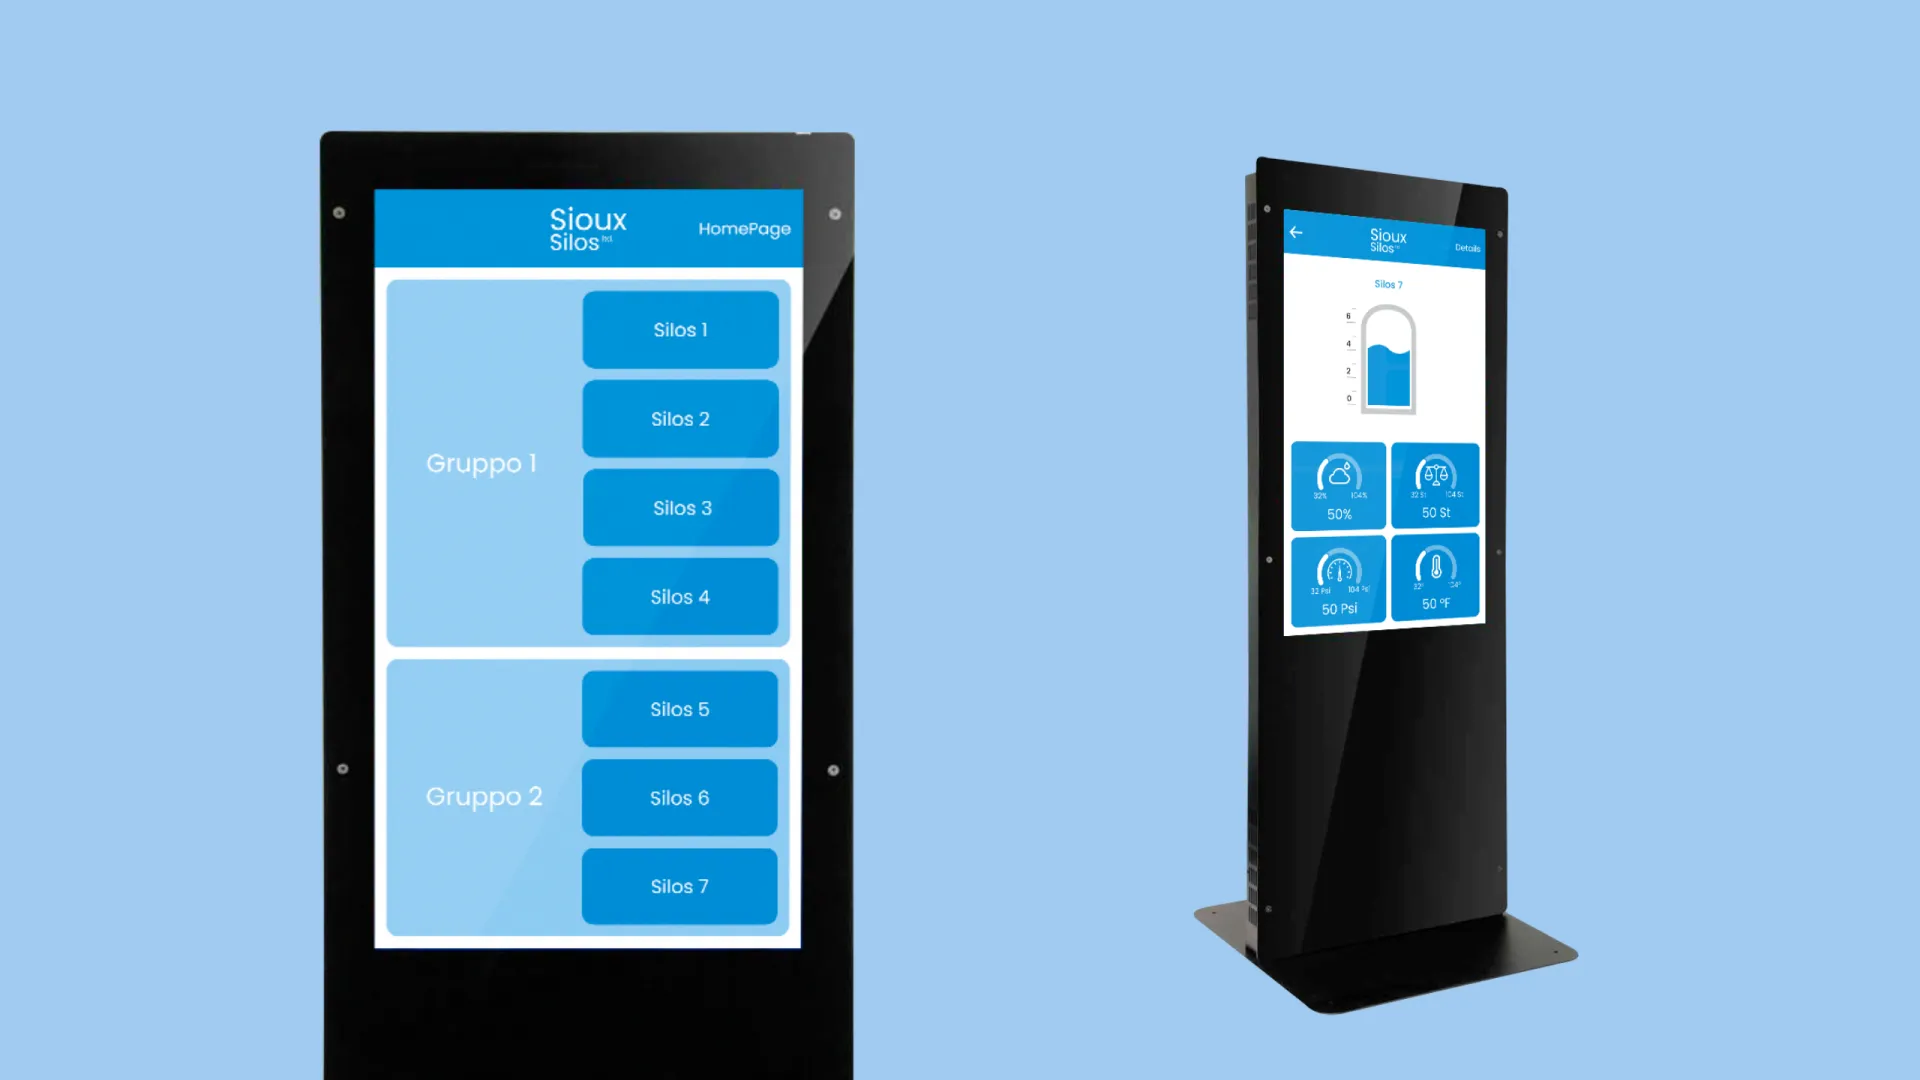
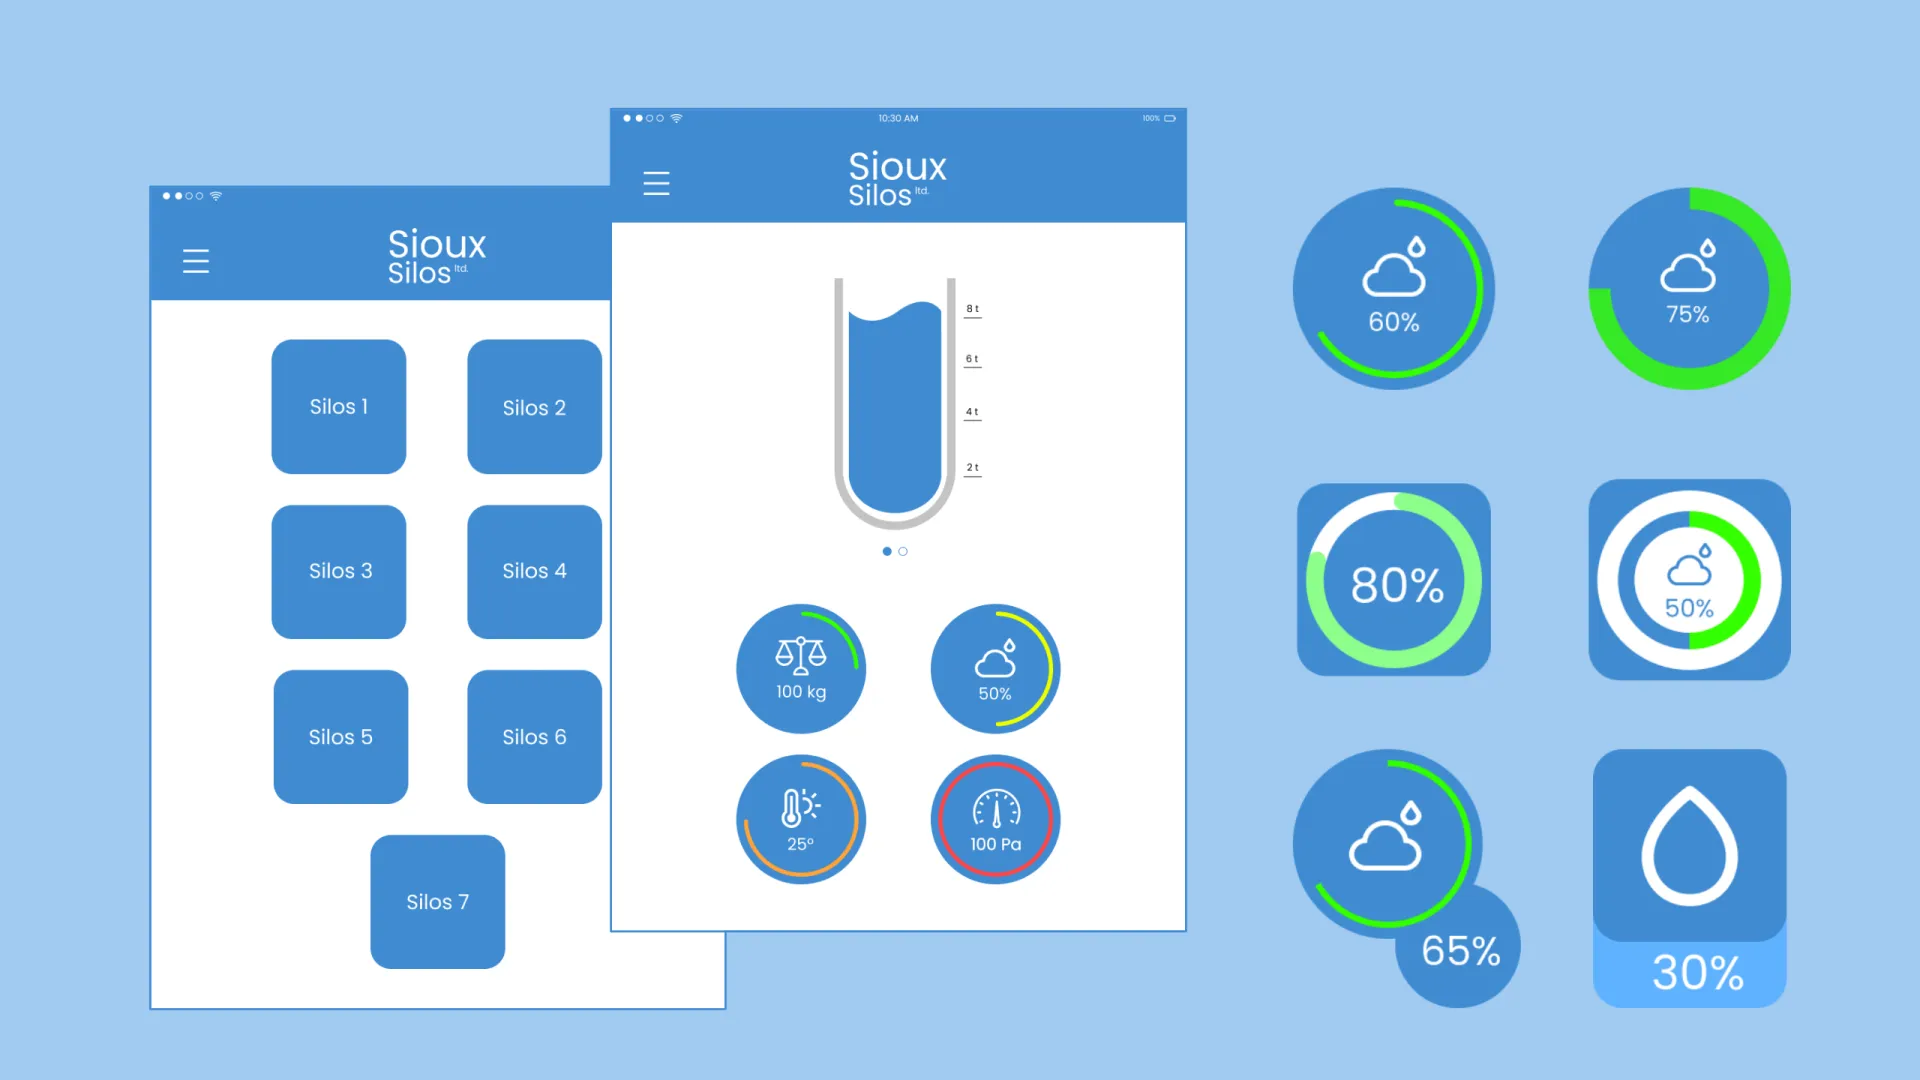
The Sioux Silos dashboard monitors and manages the status of silos through sensor data, offering a comprehensive view of vital metrics such as pressure, temperature and humidity.
The design
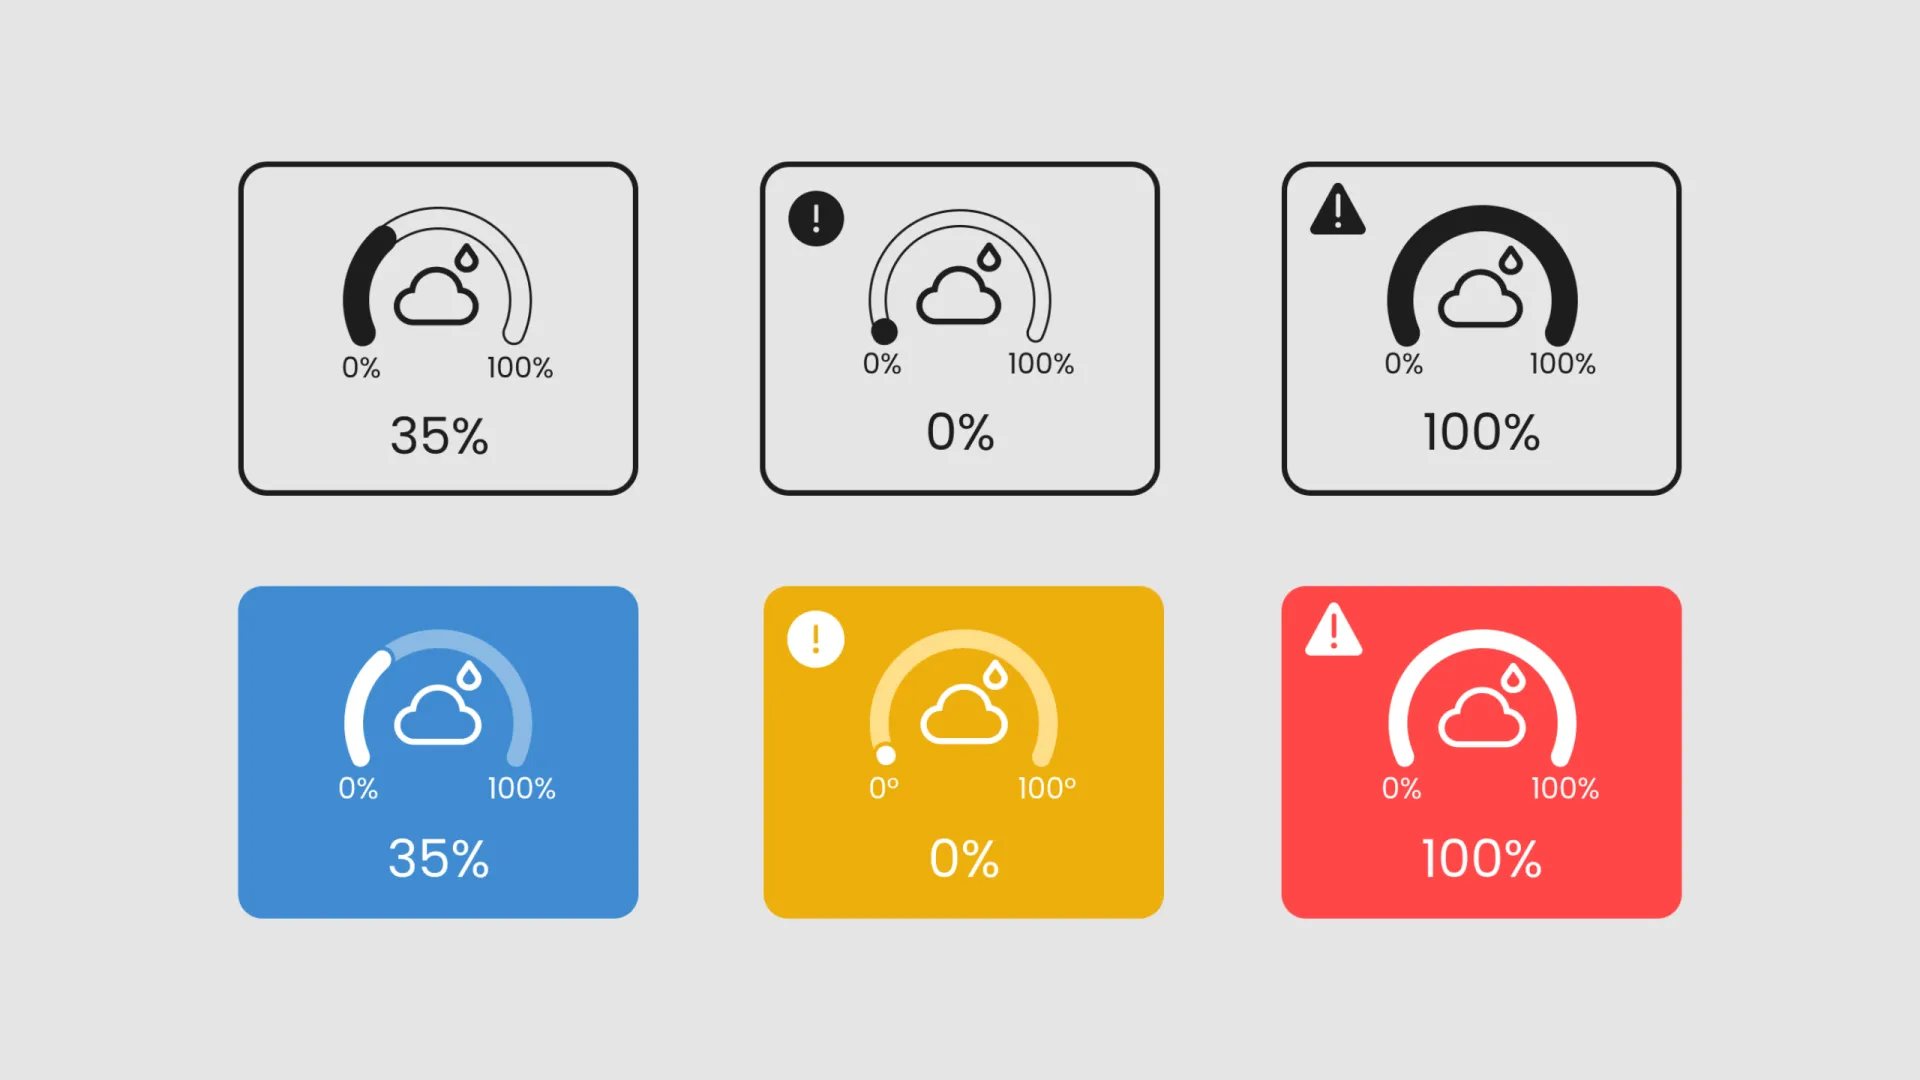
Designed in Figma with user-centric principles in mind: the visual representation of the information is clear and engaging, so that readings can be accessed and interpreted easily, and decisions taken on them efficiently.
The build
Built upon the React framework, the dashboard updates dynamically and visualizes the sensor data in real time.